
GPU utilization is probably worse than your dashboard says
I was on a call with a client's platform team, looking at their Grafana board together. GPU fleet utilization: 78%. Green. Healthy-looking line, sitting comfortably above the 70% threshold someone had set as a target a year earlier.
"So we're in good shape here," the engineering lead said. It wasn't really a question.
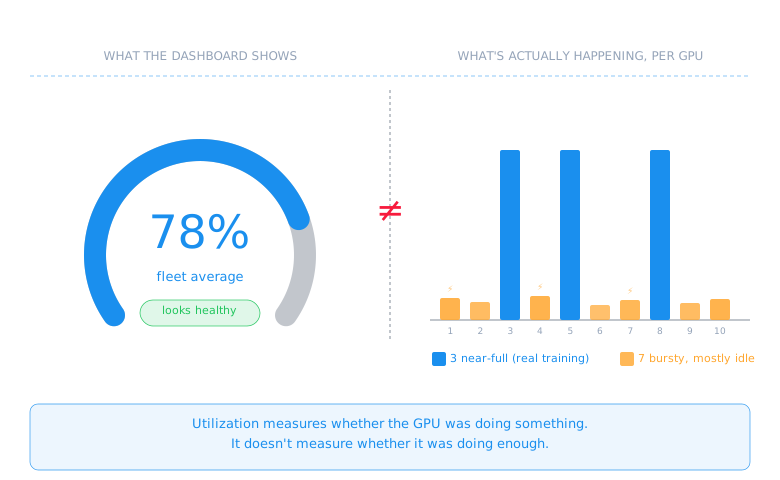
I asked them to pull up per-node utilization instead of the fleet average. Ten GPUs. Three of them were running flat out on a training job. The other seven were idling between sparse inference requests, spiking to 40% for a few hundred milliseconds every couple of seconds, then dropping back to near-zero. The 78% average was real. It was also almost meaningless.
Utilization measures whether the GPU was doing something. It doesn't measure whether it was doing enough.
That gap - between "busy" and "efficient" - is where most GPU spend quietly disappears. Here's how to actually see it.
What the number is actually counting
The standard metric, whether you're pulling it from nvidia-smi or a DCGM exporter, answers one narrow question: in this sample window, was any kernel running on this GPU at all? That's it. A GPU running a tiny, poorly-batched kernel using 5% of available compute for the entire window still reads as "100% utilized" for that window.
High utilization with low actual throughput isn't an edge case. On unoptimized inference workloads, it's the default state. The dashboard isn't lying exactly - it's answering a question nobody actually asked.
Where the fleet average hides the damage
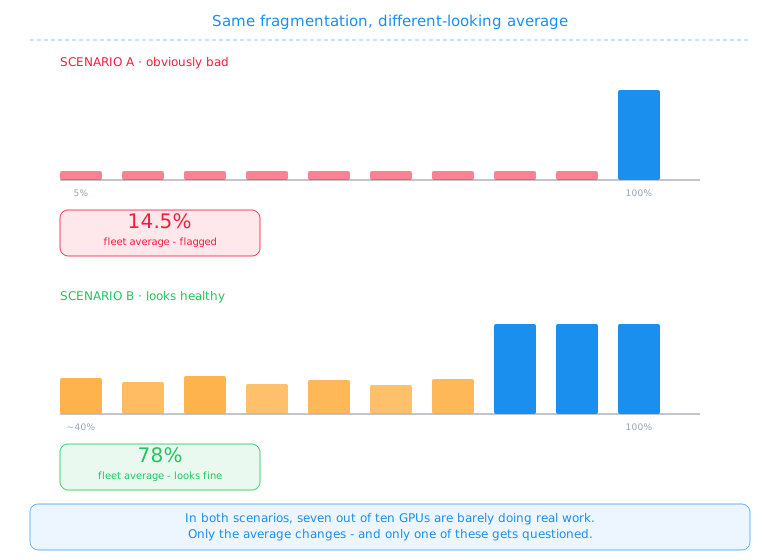
Here's the part that gets people, because it happened to that client team in front of me: a fleet-level dashboard averages utilization across every GPU you own. Nine idle GPUs sitting at 5% and one GPU pinned at 100% averages out to 14.5% - which still looks low enough to raise an eyebrow. But swap the ratio. Seven GPUs bursting to 40% intermittently and three running a genuinely full training job can average to a comfortable-looking 70-80%, while seven-tenths of your fleet is doing almost nothing useful.
The average doesn't lie about the math. It lies about what the math means.
Four things I actually trust instead
I stopped trusting the headline utilization number a while ago. These four, in combination, tell you what's really happening:
Tensor core utilization, not overall GPU activity. This is the one that would have told that client team the truth immediately. DCGM_FI_DEV_GPU_UTIL answers "was a kernel running." DCGM_FI_PROF_PIPE_TENSOR_ACTIVE answers "was the hardware you're paying a premium for actually doing tensor math." The gap between those two numbers, on the same GPU, in the same window, is usually the whole story.
# The number that looks fine
avg(DCGM_FI_DEV_GPU_UTIL) by (node)

# The number that tells you the truth
avg(DCGM_FI_PROF_PIPE_TENSOR_ACTIVE) by (node)

# The gap between them, per node - this is what I actually watch
avg(DCGM_FI_DEV_GPU_UTIL) by (node)
  - avg(DCGM_FI_PROF_PIPE_TENSOR_ACTIVE) by (node)
A wide, sustained gap on a node means it's busy without being productive. That's not a monitoring nuance. That's money.
Batch size distribution over time, not a point-in-time snapshot. Small batches are the single most common hidden cause of low real efficiency. A snapshot won't show you that your batches collapsed to size 1 for three hours overnight while traffic thinned out.
Cost per thousand tokens generated, tracked per model and per node group. This is the number that actually maps to the invoice, and it exposes fragmentation that a utilization percentage structurally cannot. Two node groups can show identical utilization and wildly different cost-per-token.
Queue depth, read alongside utilization, not instead of it. High utilization with a growing queue means you're genuinely compute-bound - you need more capacity. High utilization with an empty queue means you're inefficiently using what you already have. Those are opposite problems with opposite fixes, and utilization alone can't tell them apart.
What I told that team to do
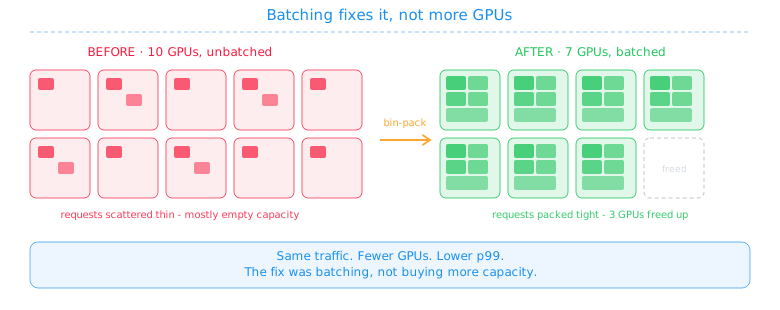
Not buy more GPUs. That was their first instinct, and I understand why - the fleet "looked busy." The actual fix was batching: bin-packing multiple models and requests onto shared GPUs instead of letting each service hold a GPU mostly to itself, and sizing node groups to the real shape of the workload instead of a round number that felt safe.
Three weeks later they'd cut their GPU node count by roughly a third, running the same traffic, at a lower p99 latency than before - because the requests that used to compete for a moment on a shared, poorly-batched GPU were now landing in properly sized batches on fewer, better-utilized ones.
Before you provision another GPU, find out whether the ones you have are doing real work, or just staying busy. Those are not the same question, and only one of them is on your dashboard by default.
If your fleet dashboard has been sitting in the comfortable-looking 70-80% range for a while and nobody's checked the tensor core number underneath it, that's worth an afternoon. I'd be curious what you find.